Micro-computed tomography, also known as Micro-CT, is the preclinical analogue of clinical CT, providing higher spatial resolution (voxel size <= 100 microns) for imaging small animal models of disease. The growing interest in small animal models and the development of new X-ray detectors stimulated considerable development of dedicated small animal scanners in the 1990s. Now, Micro-CT systems have become highly sophisticated and are an essential part of preclinical imaging centers in both academia and industry. Conventionally, the samples can be analyzed almost without any sample preparation process generally in a non-destructive way [1]. In the poster, Biocytogen present a series of applications for both in vivo and ex vivo imaging.
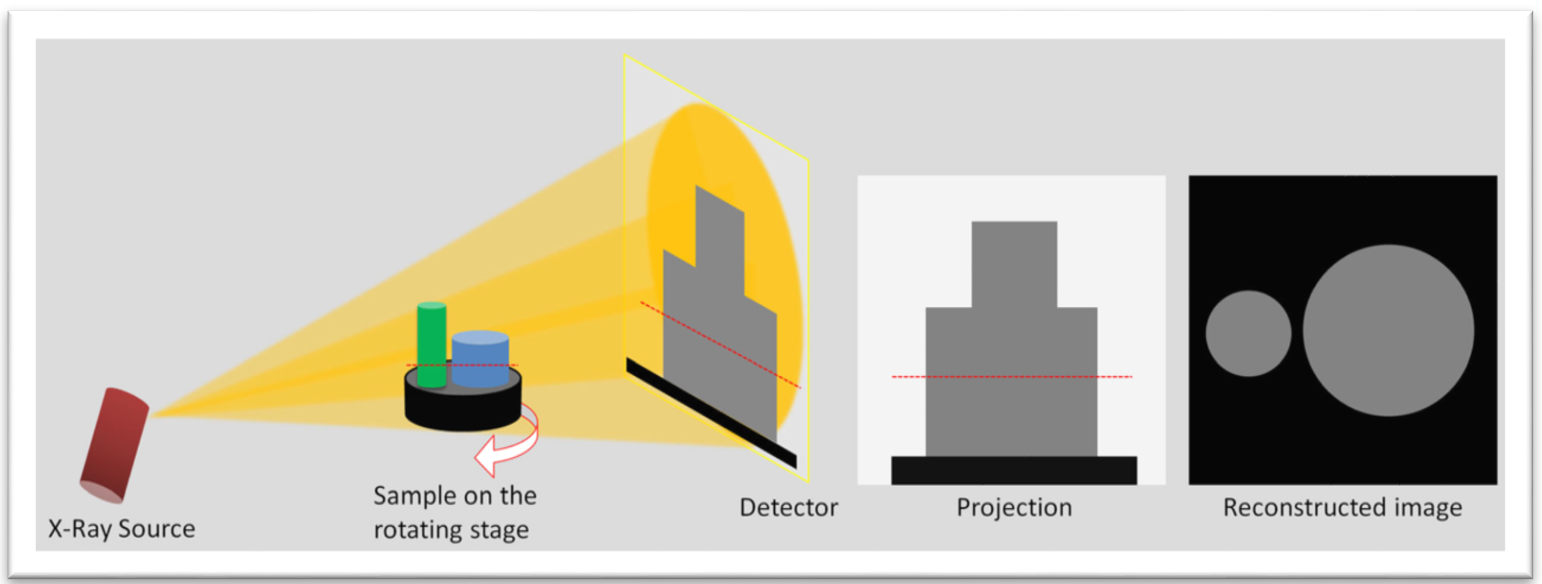
Schematic illustration showing the basics of Micro-CT.[2]
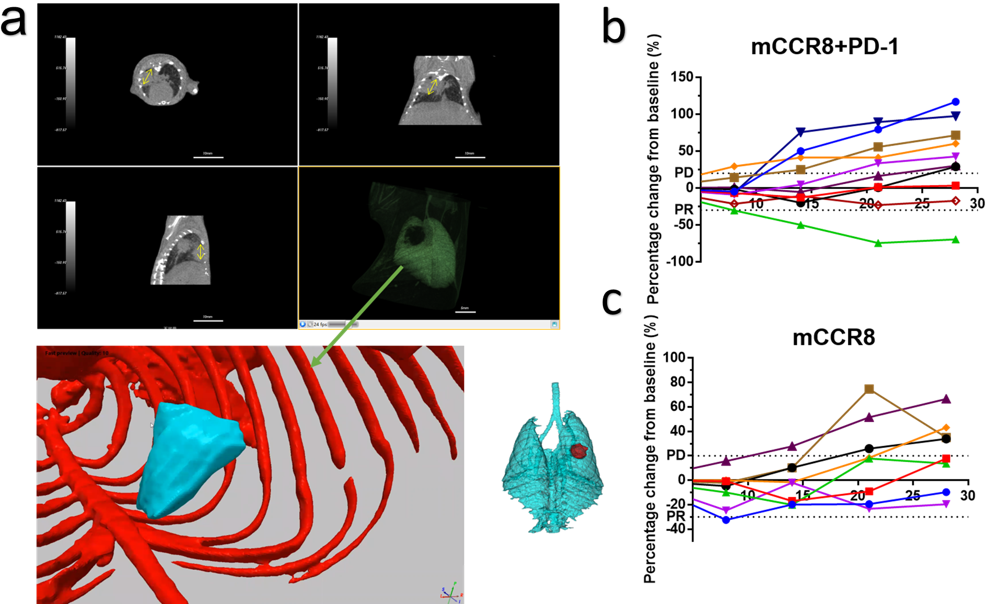
Figure 1. Evaluation of the anti-tumor efficacy of test articles in aged FVB mice with spontaneous lung tumors. (a) The top image represented spontaneous lung nodules in aged mice which showed the reconstruction images of transverse plane, coronal plane, sagittal plane (the lung was displayed in green). The image at bottom left represented 3D generated by software of “Simpleware" (Bone was marked in red and the tumor was marked in blue). The 3D image at bottom right represented pulmonary tumor (in red). (b, c) Percentage change from baseline after antibody treatment in single-arm study in FVB mice with spontaneous tumor. (n=10/8 per group)
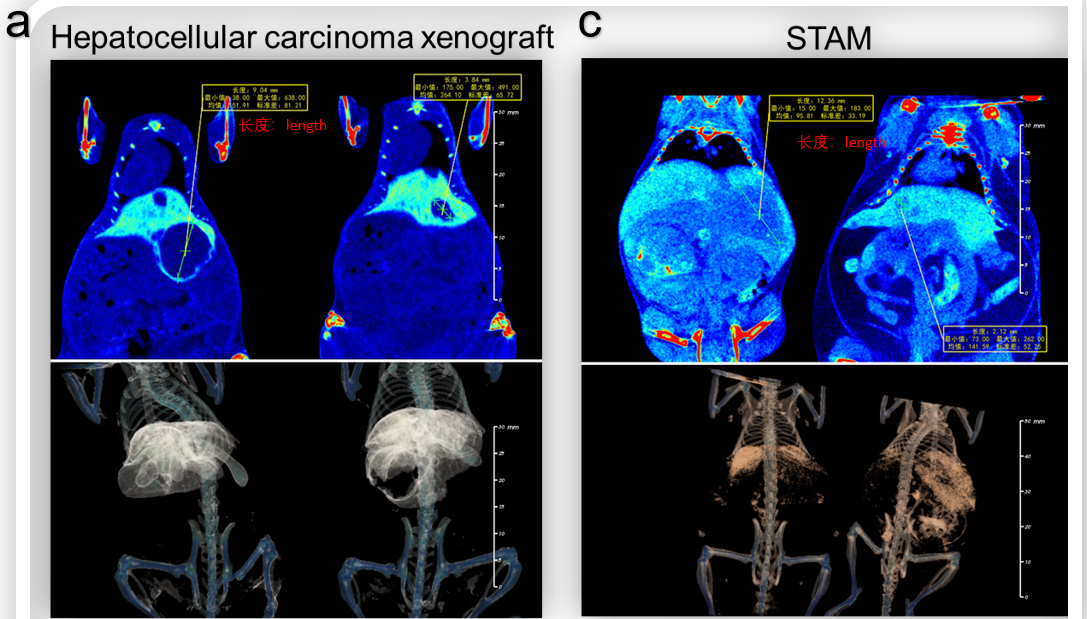

Figure 2. Detection of hepatic tumors in situ-inoculated mice and induced liver tumor in STAM model by Micro-CT. (a) Micro-CT image and tumor growth curve (b) of orthotopic model of B-luc Hep 3B plus in B-NDG hIL15 mice. Scanning was taken 14 days after inoculation. (c) Micro-CT image of liver tumor of C57BL/6 mice in Streptozotocin (STZ) and high-fat diet induced STAM model. (d) Maximum length of tumor in STAM model. Data recorded from 20 weeks after induction.

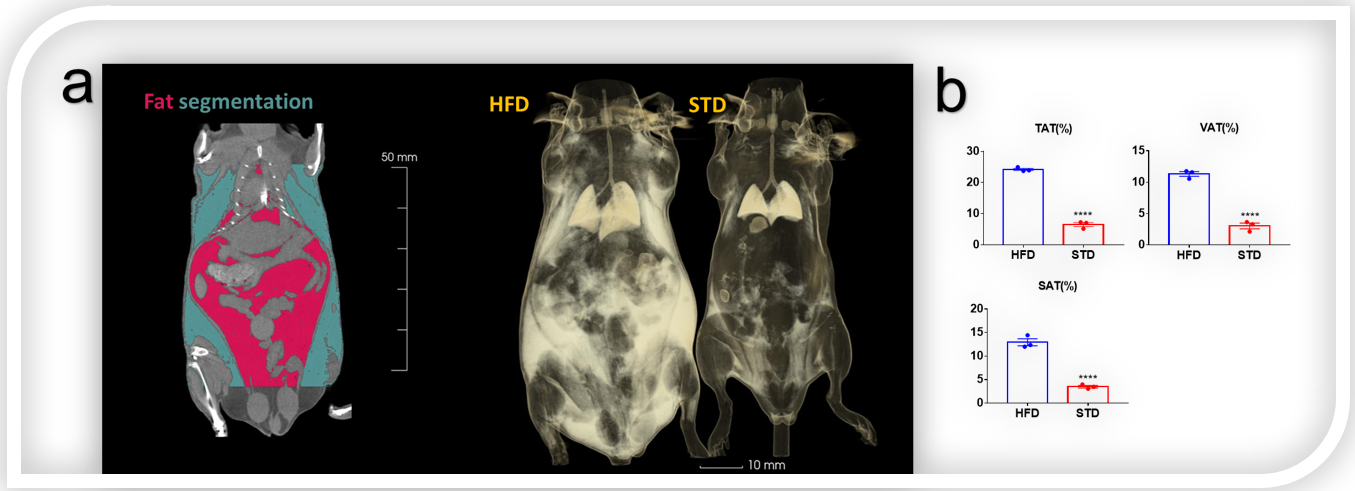
Figure 3. Fat segmentation and 3D reconstruction of fat in obese mice and wild mice by Micro-CT. (a) Visceral fat and subcutaneous fat were marked in red and green, respectively. The reconstruction map showed that there was a large amount of fat in the viscera and subcutaneous of High fat diet (HFD) induced obese mouse, and almost no obvious fat accumulation in standard diet (STD) mouse. (b) Total adipose tissue/body weight (TAT%), subcutaneous adipose tissue/body weight (SAT%), visceral adipose tissue /body weight (VAT%) of HFD group and STD group.

Figure 4. Quantitative diagnosis of fatty liver by Micro-CT. (a)The liver region of interest reconstructed by Micro-CT. (b) Standard for quantitative diagnosis of fatty by Micro-CT. (c) Analysis results for region of interest of the obese mice liver by software (Avatar3). (d) Average CT value of mice liver after high fat diet (HFD) and standard diet (SD) for 25 weeks.
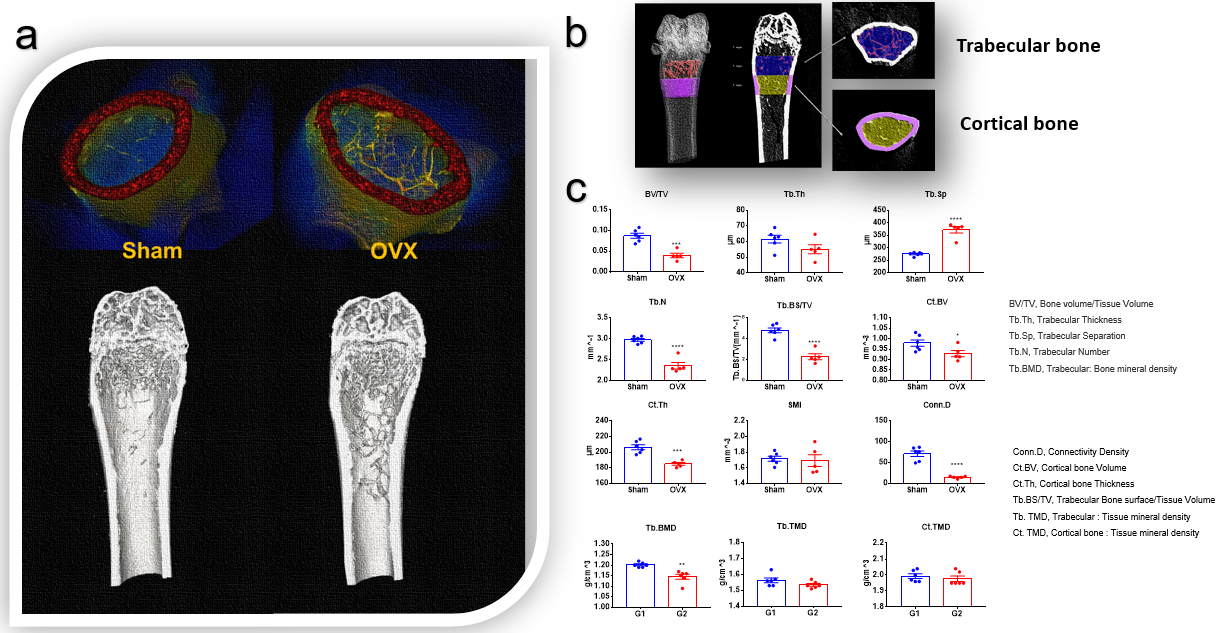
Figure 5. Femur analysis in ovariectomy induced osteoporosis model ex vivo. C57BL/6 mice received ovariectomy on day 0. Six weeks after operation, femurs were harvested and analyzed by Micro-CT ex vivo. (a) 3D reconstruction images of sham operation group (sham) and operation group (OVX). (b) Trabecular bone and cortical bone area of femur. (c) Statistics of trabecular bone, cortical bone structural and density parameters of femurs in Sham and OVX treated group. In conclusion,the osteoporosis model was successfully established in C57BL/6 mice.
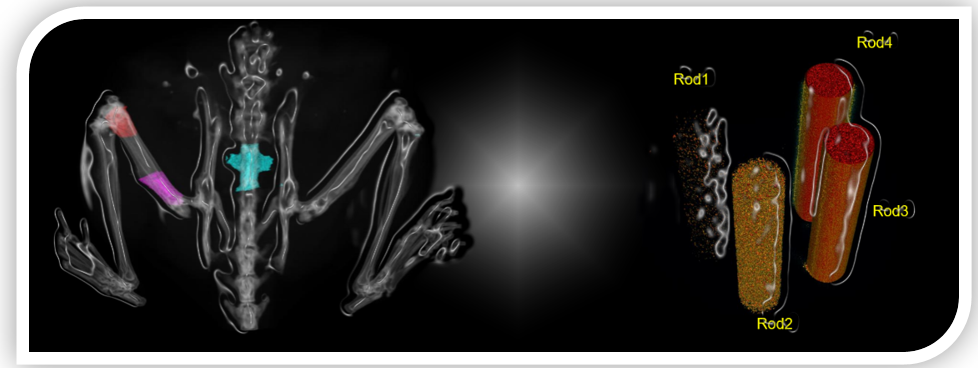
Figure 6.1. The measurement of bone mineral density of mice in vivo. Micro-CT supported user-defined areas and lengths, such as the distal femur in the red area, the proximal femur in the purple area, and the spine, Rod1, Rod2, Rod3 and Rod4 were hydroxyapatite with different densities.
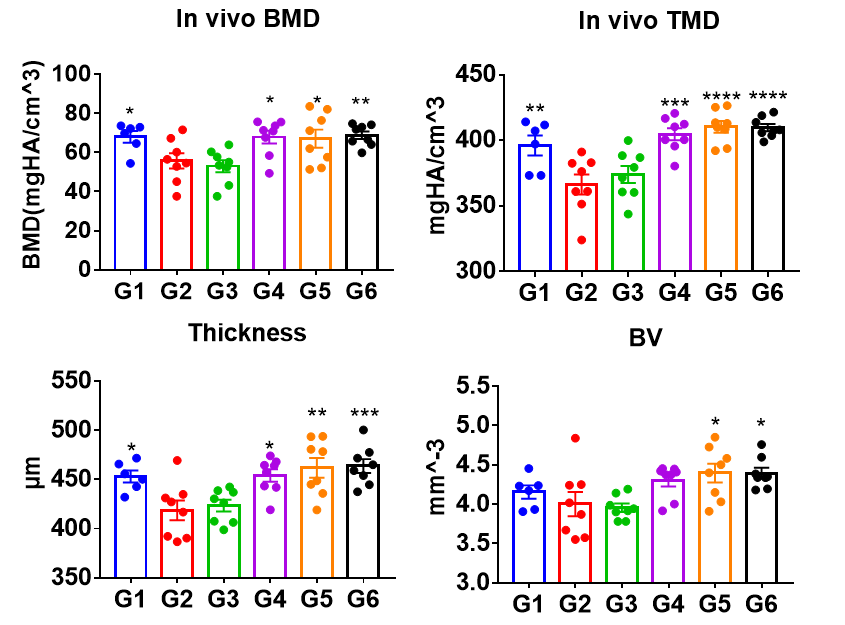
Figure 6.2. Femur analysis in B-hRANKL mice after antibody treatment in osteoporosis model. Osteoporosis was induced in B-hRANKL mice (7 weeks-old) via ovariectomy. Six weeks after ovariectomy, mice were treated with PBS (G2), isotype control (G3), test articles (G4~G5) for 4 weeks. G1 was sham group (G1). G2~G6 were osteoporosis modeling groups. Bone mineral density (BMD) of medullary cavity area and tissue mineral density (TMD), thickness and bone volume (BV) of cortical bone were analyzed in vivo by Micro-CT. Data was shown as Mean±SEM, and analyzed using One way ANOVA followed Dunntett compared with G2, “in vivo BMD”, compared with G3.
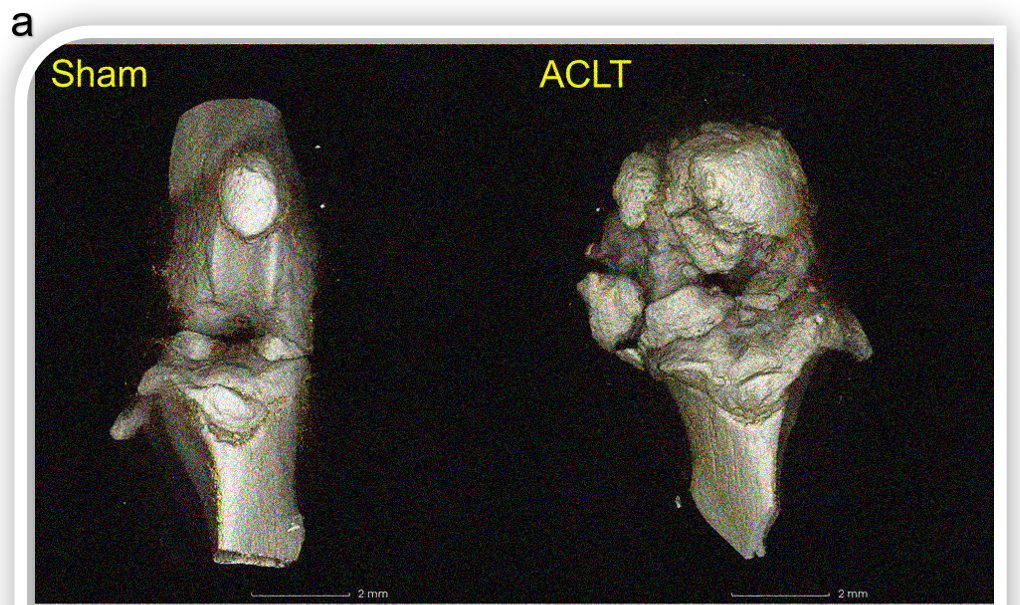
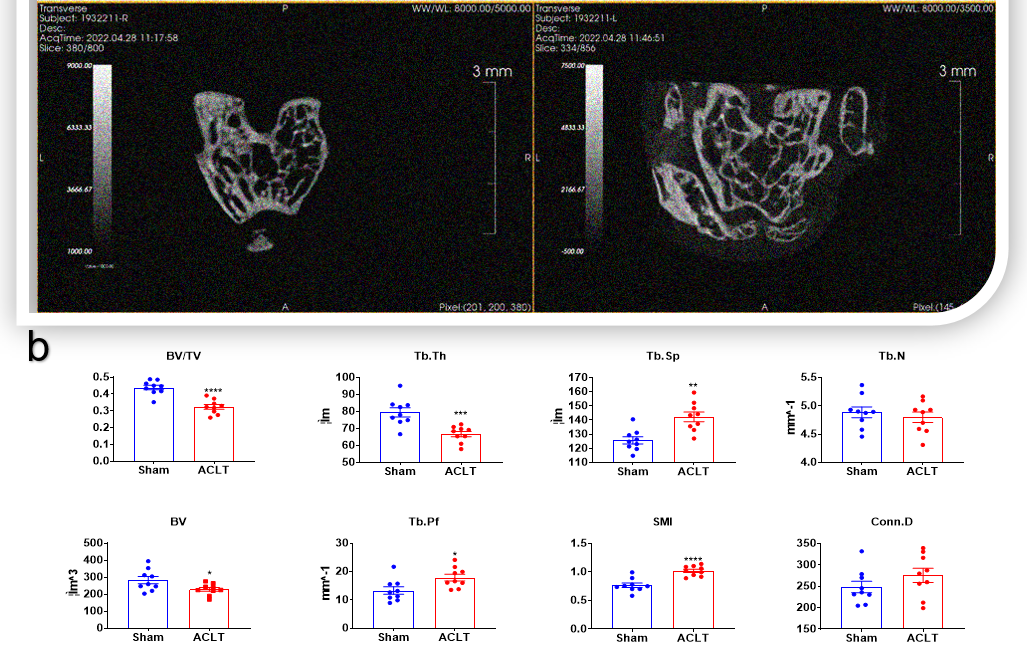
Figure 7.1. Anterior cruciate ligament transection (ACLT) surgical models of osteoarthritis (OA). (a) C57BL/6 mice received anterior cruciate ligament transection (ACLT) on day 0. Ten weeks after operation, knee joints were harvested and analyzed by Micro-CT ex vivo. 3D reconstruction image showed extensive hyperplasia and wear of subchondral bone in the operation group. Cross section of subchondral cancellous bone of tibia showed that bone volume in the operation group was decreased.(b) Data represented the structural parameters of subchondral cancellous bone and the parameters of tibial plane.
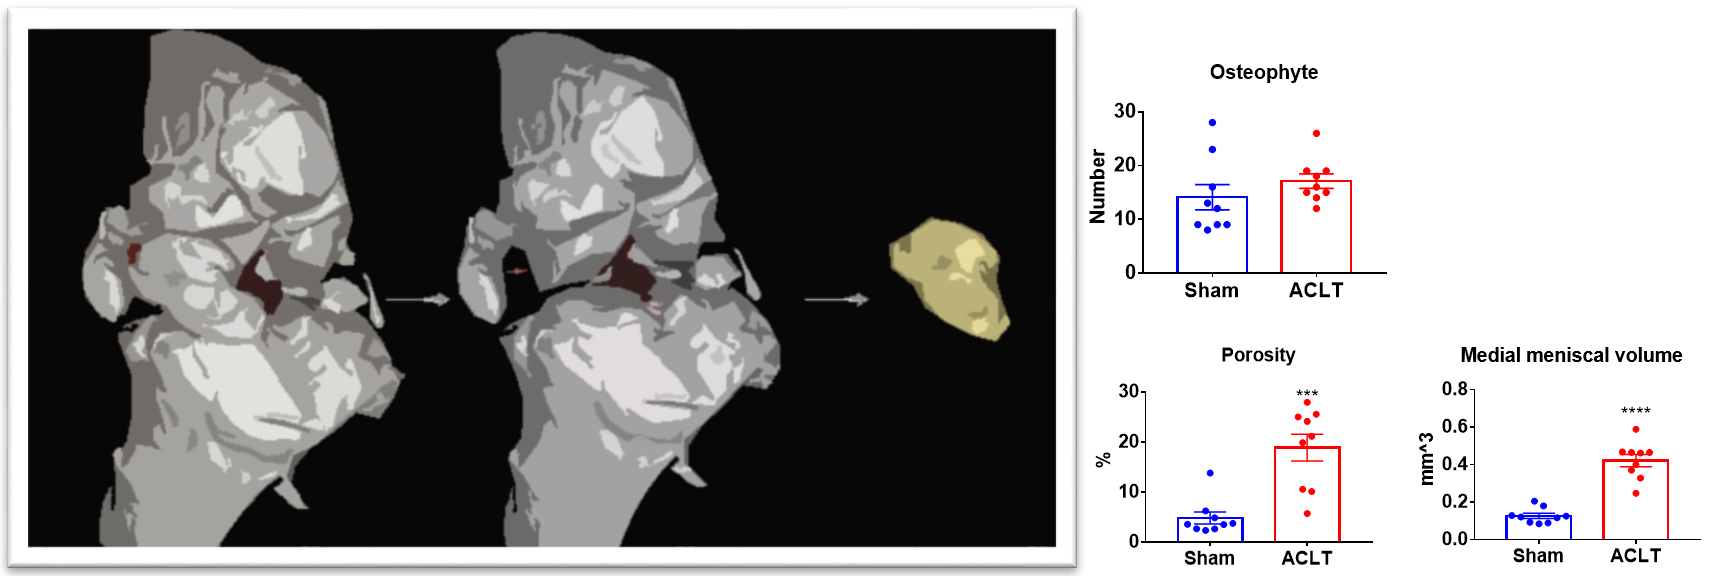
Figure7.2. 3D reconstruction of medial meniscus. Data showed the number of osteophytes, the volume of medial meniscus, porosity, and cortical bone thickness of Sham group and ACLT modeling group.
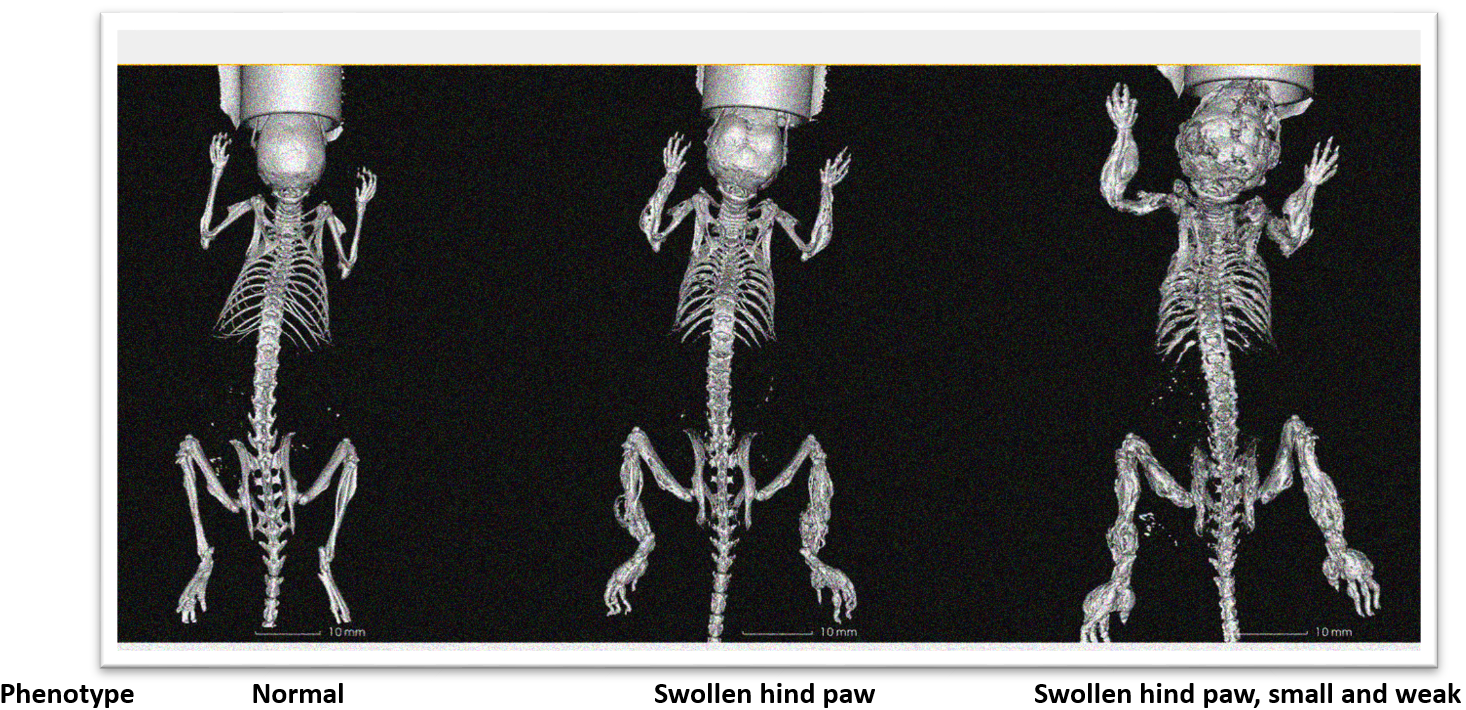
Figure 8. 3D reconstruction of mice with Camurati-Engelmann disease. 3D reconstruction showed that the long bones (limbs) of mice with abnormal phenotype had multiple bone fractures, bone thickening and bending. Obvious abnormalities can be seen in skull, hip and ischia.
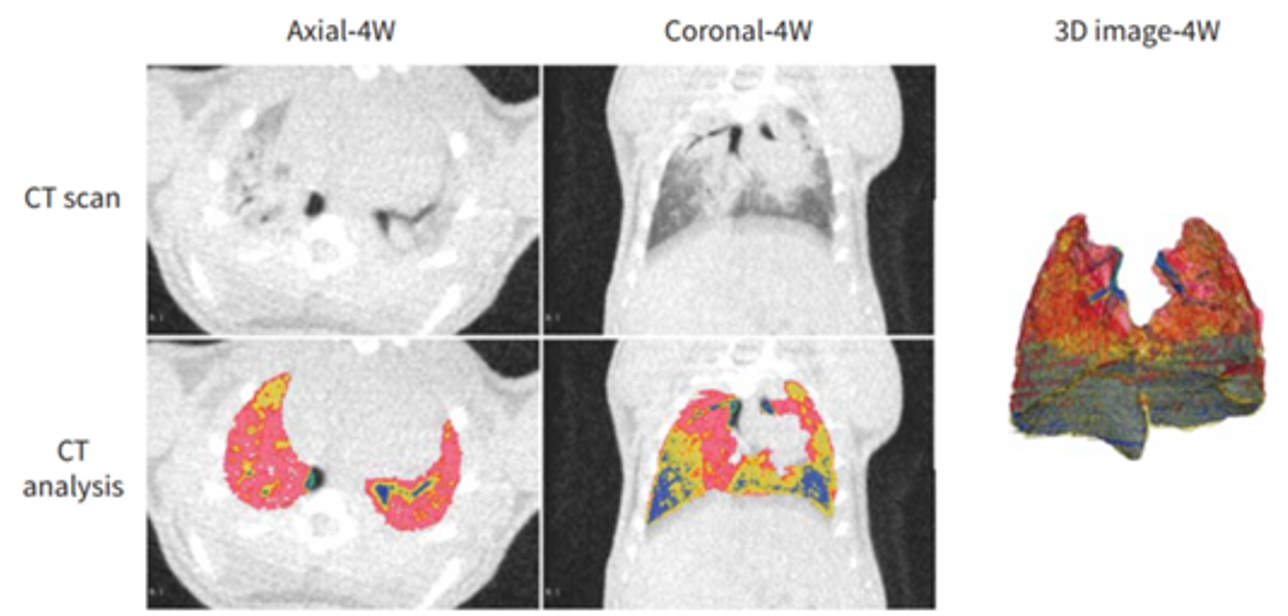
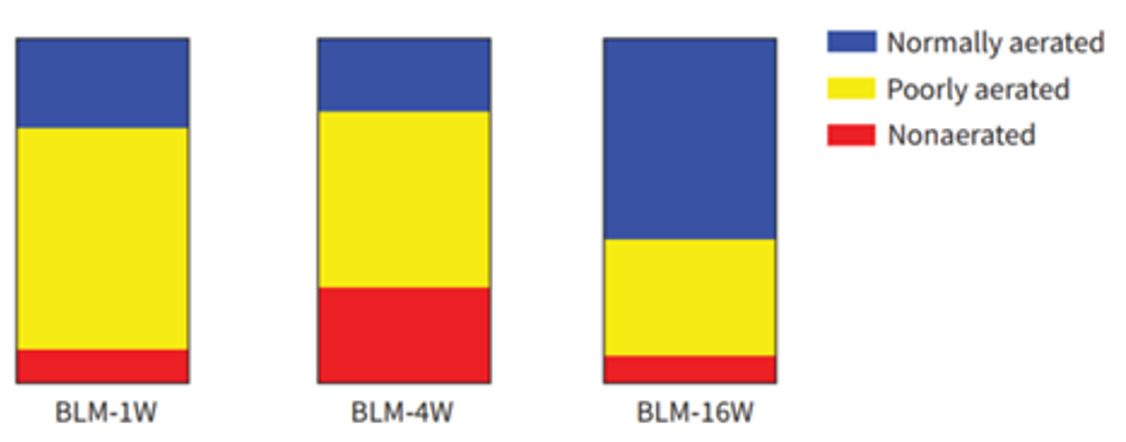
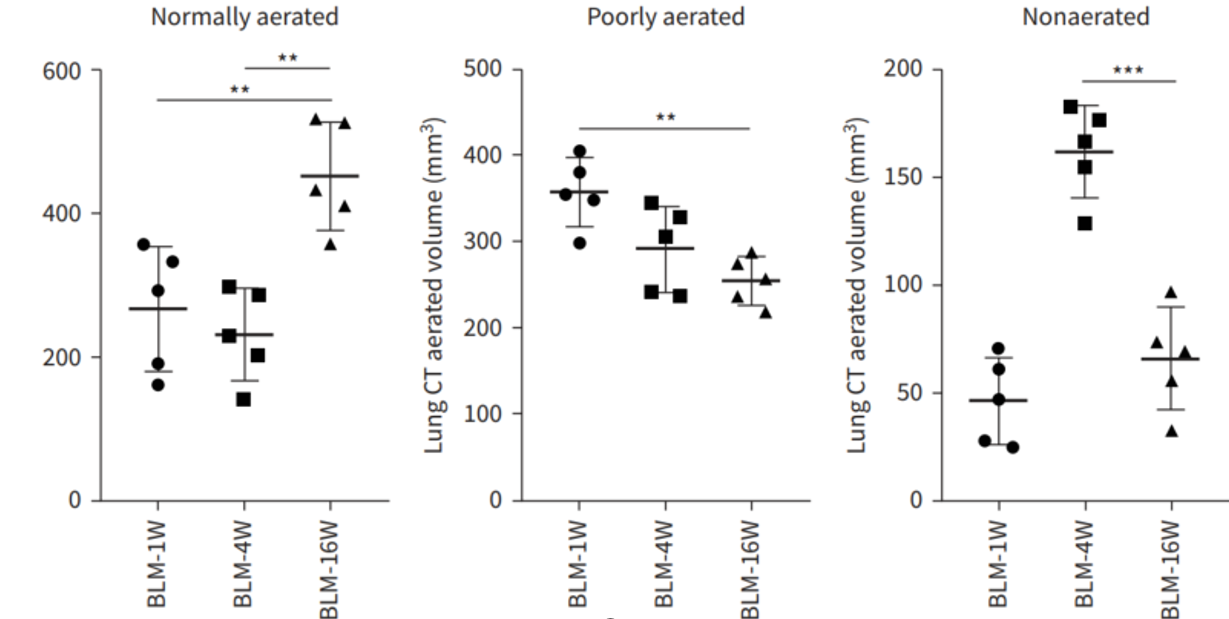
Figure 9. Quantitative computed tomography (CT) volumetric evaluation of lung aeration. Representative colour map analyses of lung CT images from bleomycin (BLM)-treated mice at week 4. Blue: normally aerated region; yellow: poorly aerated region; red: nonaerated region. Dynamic percentages of lung CT aerated volume in representative mice at the indicated time-points after BLM. Further lung volumetric analysis showed that the proportions of both poorly aerated and nonaerated regions were significantly increased before week 4, and then pronouncedly decreased between week 10 and week 16, whereas those of normally aerated areas exhibited the opposite trend [3].
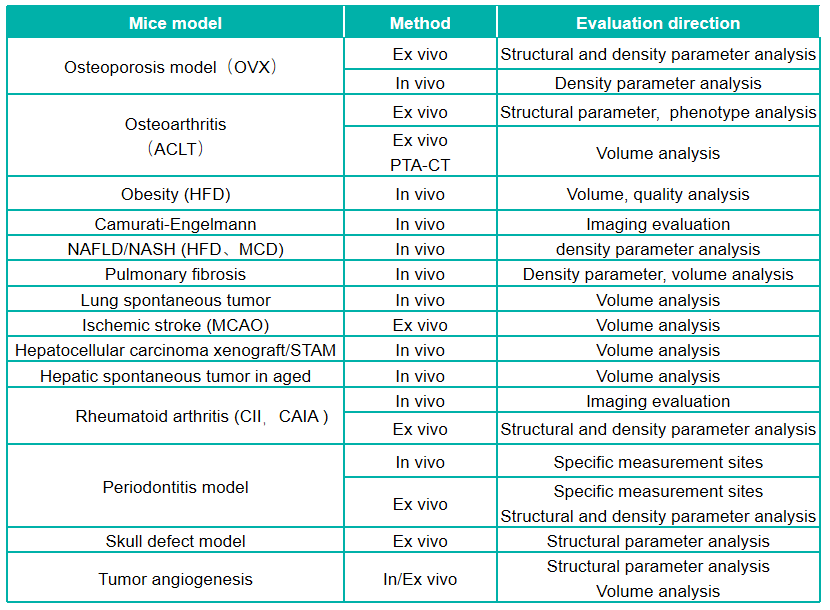
Service content
Conclusion
As a non-destructive and high-resolution imaging technique, Micro-CT can be used complimentarily with other imaging techniques in an attempt to integrate the visual results of the different methods and, thus, reach more solid scientific conclusions. The intrinsic physical limitations of each imaging technique have led to more comprehensive approaches by the combination of several techniques, compiling a broader range of information from cell and tissue-level histomorphology to three-dimensional structures [4].
References
[1] Clark D P , Badea C T . Advances in Micro-CT imaging of small animals[J]. Physica Medica, 2021, 88(6):175-192.
[2] Cengiz I F , Oliveira J M , Reis R L . Micro-CT -a digital 3d microstructural voyage into scaffolds: a systematic review of the reported methods and results[J]. 2019.
[3] Song Shengren,Fu Zhenli,Guan Ruijuan et al. Intracellular hydroxyproline imprinting following resolution of bleomycin-induced pulmonary fibrosis.[J] .Eur Respir J, 2022, 59.
[4] Keklikoglou K , Arvanitidis C , Chatzigeorgiou G , et al. Micro-CT for Biological and Biomedical Studies: A Comparison of Imaging Techniques.[J]. Journal of imaging, 2021, 7(9).


 +86-10-56967680
 info@bbctg.com.cn